Overview
Modern businesses rely on web applications to drive revenue and customer trust, but teams often have no way of knowing a critical user flow is broken until customers start complaining. By then, the damage is done.
Synthetics addresses this by proactively simulating a customer's clickpath on a website or web application, reporting alerts before real users are impacted. Tests surface early insight into end user experience quality by tracking availability and latency metrics and flagging potential issues at threshold violation, instead of after the fact. As the designer owning LogicMonitor (LM) Websites, I drove the end-to-end design process, from discovery research and ideation through wireframing, user testing, and high-fidelity UI delivery, in close collaboration with PM and engineering. This project shipped.
Context
chevron_right
Read more about Selenium file or LM Synthetics
expand_less
Collapse Selenium file or LM Synthetics
Synthetics is an important and envision feature to LogicMonitor (LM) that complements LM traditional monitoring of core website vitals into uptime and availability. By simulating scripted web checks, LM Synthetics helps users to observe the transaction performance of their hosted webpages, receives alerts on breakdown sections before they caused negative impacts, and optimize websites health and improve end-user experience.
LM Synthetics monitoring leverages Selenium—an open access, open source browser automation and scripting tool—to send Synthetics data to LogicMonitor. Selenium plugin script down end users' action on the web. Uploading the downloaded script (.side) to LM, users are able to monitor and observe simulated customer experience with their websites, before those problems led to substantial impacts. More could be found via this link.

Last puzzle to website monitoring
To broaden LM's monitoring capacity beyond basic checks that monitors status and latency, Synthetics gives companies visibility into how their website's advanced features perform from their users' perspective.
(Business)

Technology configuration
The product uses Selenium IDE, an open source browser extension to record simulated interaction with website elements and generate the test scripts. Users record their clickpaths using the Selenium plugin, upload the script to LogicMonitor, deploy collectors, and receive alerts whenever an error is triggered by a threshold violation.
(Technical)

Where the product lives
In correspondence to users' request of a single pane of configuration and observability, Synthetics will be another type of "Resource" monitored.
(Product decisions)
Prior to this project, LM already allowed users to receive alerts about an uploaded Selenium file as a resource. The critical gap was that there was no way for users to observe their website transactions through monitoring breakdown sections, leaving them unable to pinpoint exactly where in a flow something went wrong. The design goal for this product was therefore clear: enable users to know precisely where a transaction failed.
Why this product?
Kicking this off with Paige (PM), I had a preliminary picture about the goals this product needs to achieve:
More powerful and more granular
Perform web checks with more complex requests than URL status check. For e-commerce websites, what matters more is whether the payment button works and how much time each step (adding to cart, checking out) takes. Simple URL status detection cannot test this granular information.
More efficient
Instead of requiring users to set up a series of individual web checks, or writing scripts for the complex checks above, Synthetics aims to make the process intuitive and hassle-free.
More integrated
Together with URL check, Synthetics will be added as a new type of Resources, so that users could build dashboard or confirgure alerts in a unified way and LM could actually be a unified observability platform.
Primary Use Cases
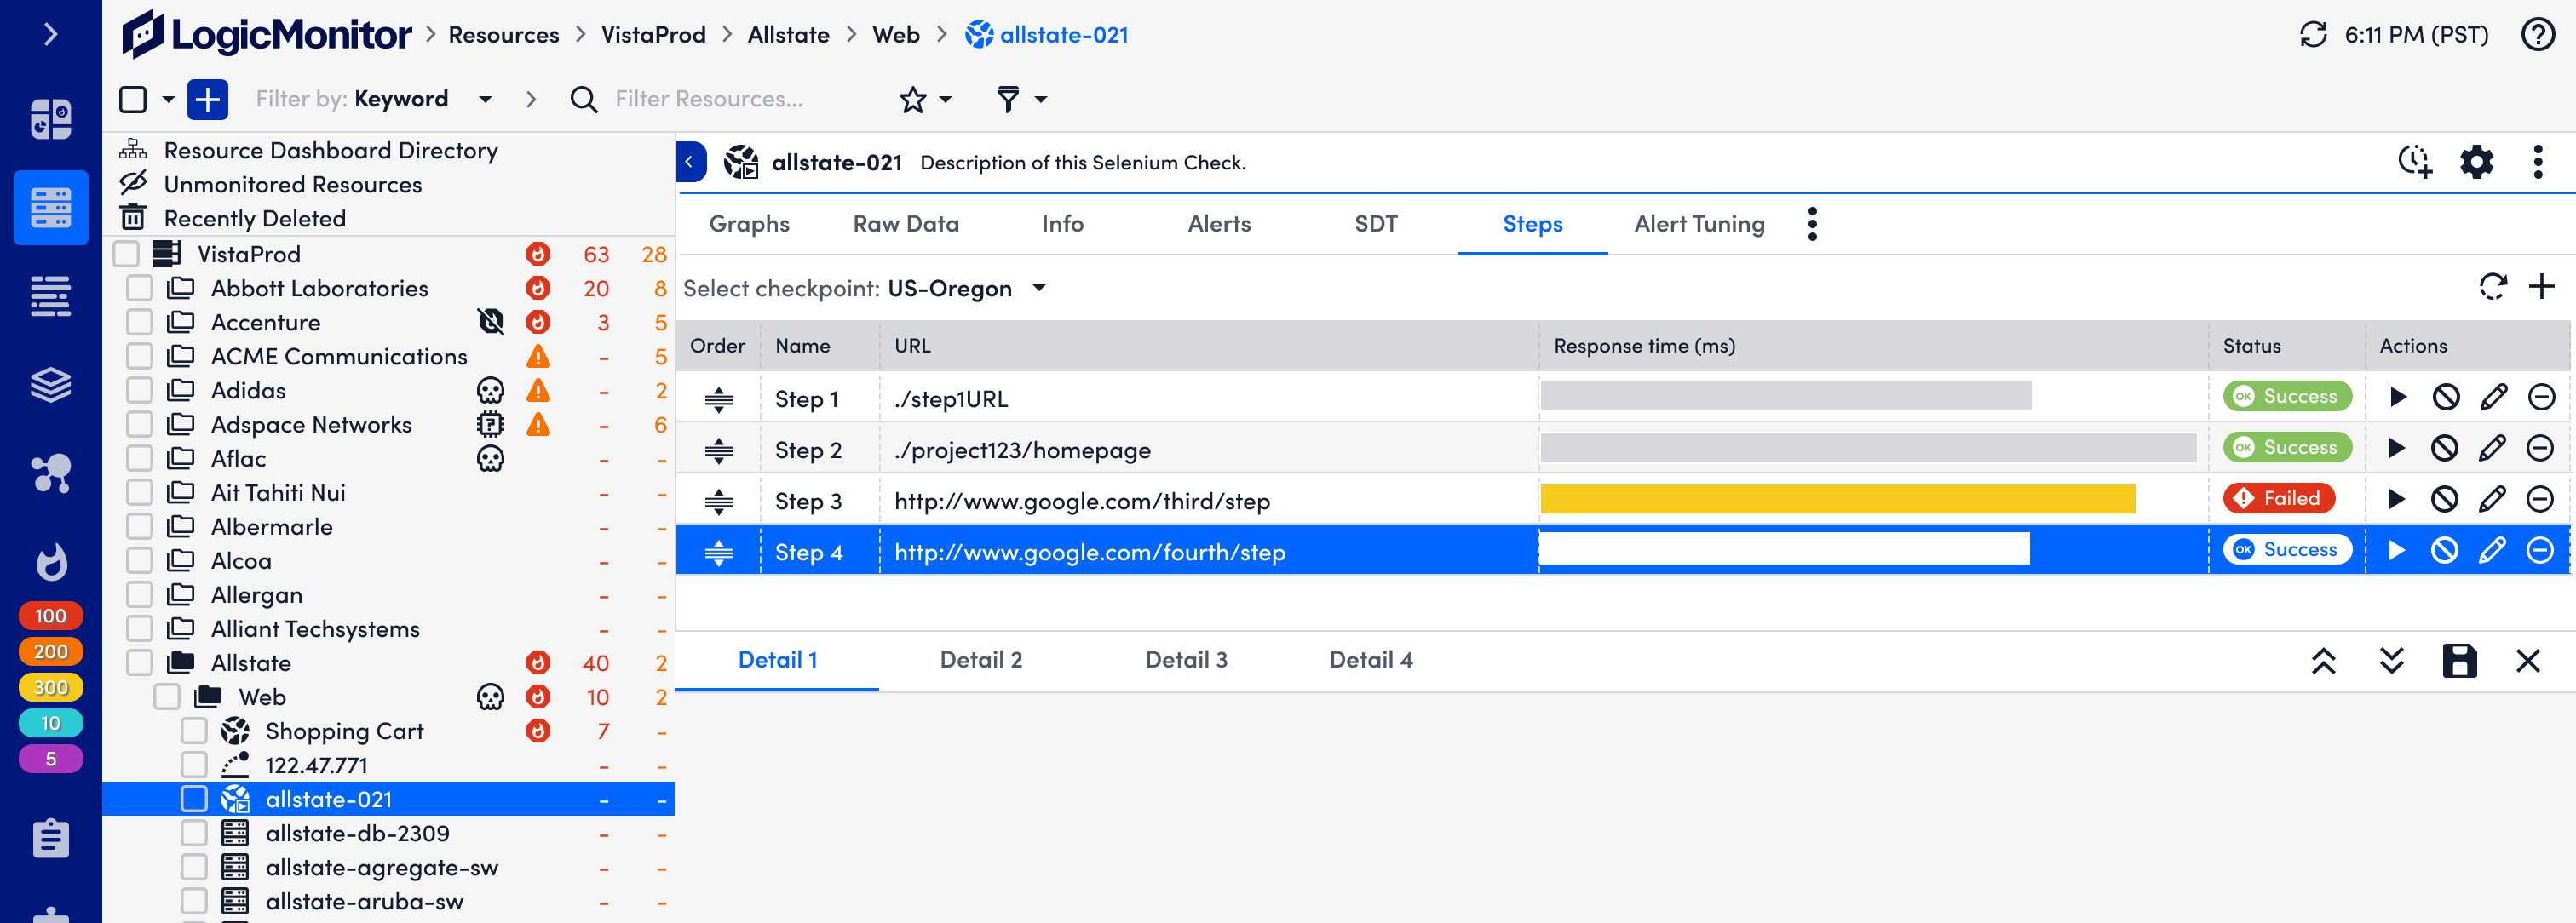
The user can break out their Selenium test file into arbitrary steps, i.e. they have the ability to designate what is considered a "Step".
The user can see the latency information of each step.
Any errors would show the step on which it was encountered.
The user can alert on criteria for each step.
The user needs to be able to see the status of their Synthetic checks per test, per step, and per location.
Semi-structured User Interviews
I first need to understand users' goals and challenges encountered. Wearing multiple hats in LM, I started with foundational research with our customers. Interviewing 10 enterprise users inquiring about website monitoring goals, data to be collected, and the key information they want to find when looking at Synthetics page. The research reveals:
1. Users now uses basic web checks to monitor website uptime, response time, SSL certification status, and content verification. There is an inbound need to perform more complex monitoring, such as log in, or the latency of webpage for large data queries.
"Some customers are interested in performance of certain aspects, or maybe cretain pages. Maybe they have some pages that have large database queries etc. Some pages, depending upon the load on the servers are or what the page is doing may take 1-2 mins to response or longer to return a specific request. They’re interested in make sure that doesn’t exceed a certain time frame."
2. Users are driven to check the Synthetics page by alerts. The primary value of Synthetics landing page is providing users the details information related to the alerted check for them to triage and troubleshoot.
"Want to see the most recent / current one. Chances are if I’m looking at it is because sb got an alert or complaining, I want to look at it and see what it’s doing now."
3. Historical records mattered a lot too. Users would want to recognize errors that happened repeatedly and define a pattern from the history. The historical records will help users validate the severity of a reported alert: is it a recurring issue or one-time thing? Users will also benefit from relating it to a history issue with referring to previous solutions.
“Historical data is always incredibly important. Maybe this is a recurring issue that happens at a specific time of the day. Maybe it’s happening the same time that a backup is taking place. That might indicate we might have to change the backup schedule or we’ll have to change how the backup is conducted.”
“If you're trying to troubleshoot an alert, one of the important things that you do is to evaluate whether this is a recurring issue. Maybe this has been resolved in the past, let me go find the ticket with the resolution.”
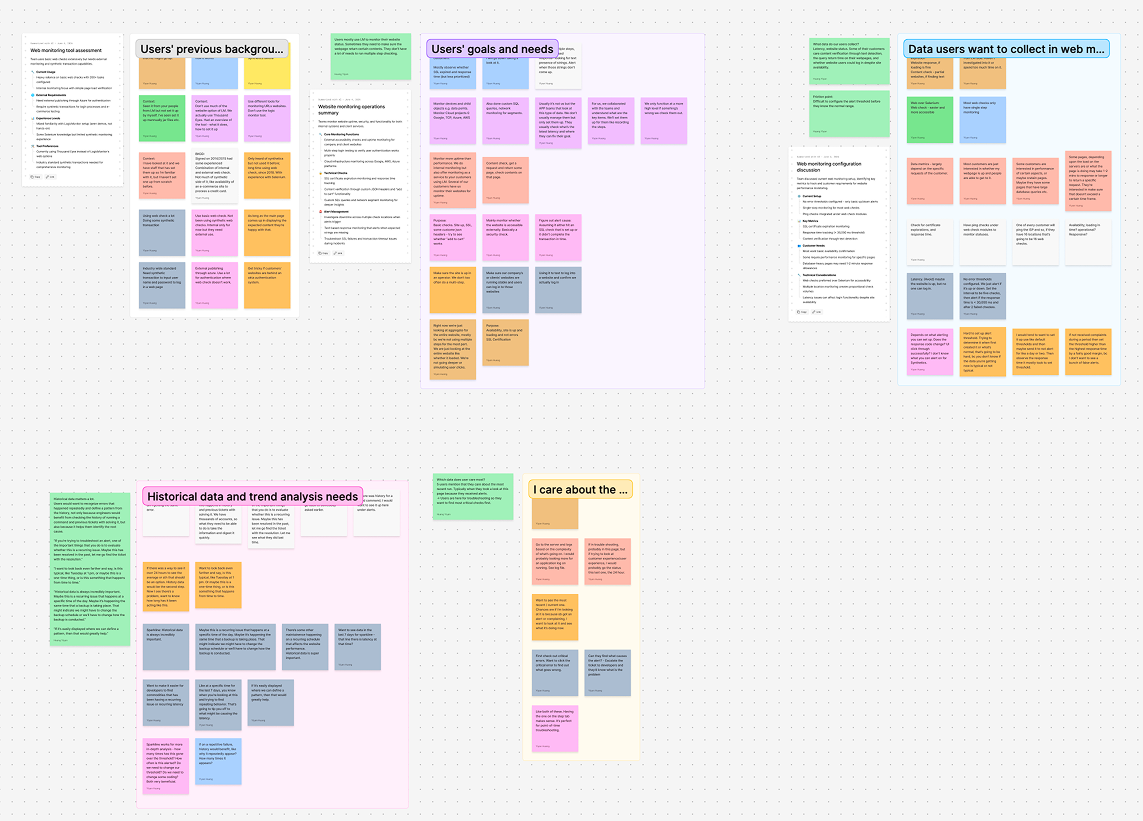
Research notes ->
Affinity map of research insights
User flow
<Insert user flow chart ->>
Design breakdown
How might we enable users to create Synthetics checks and configure Steps?
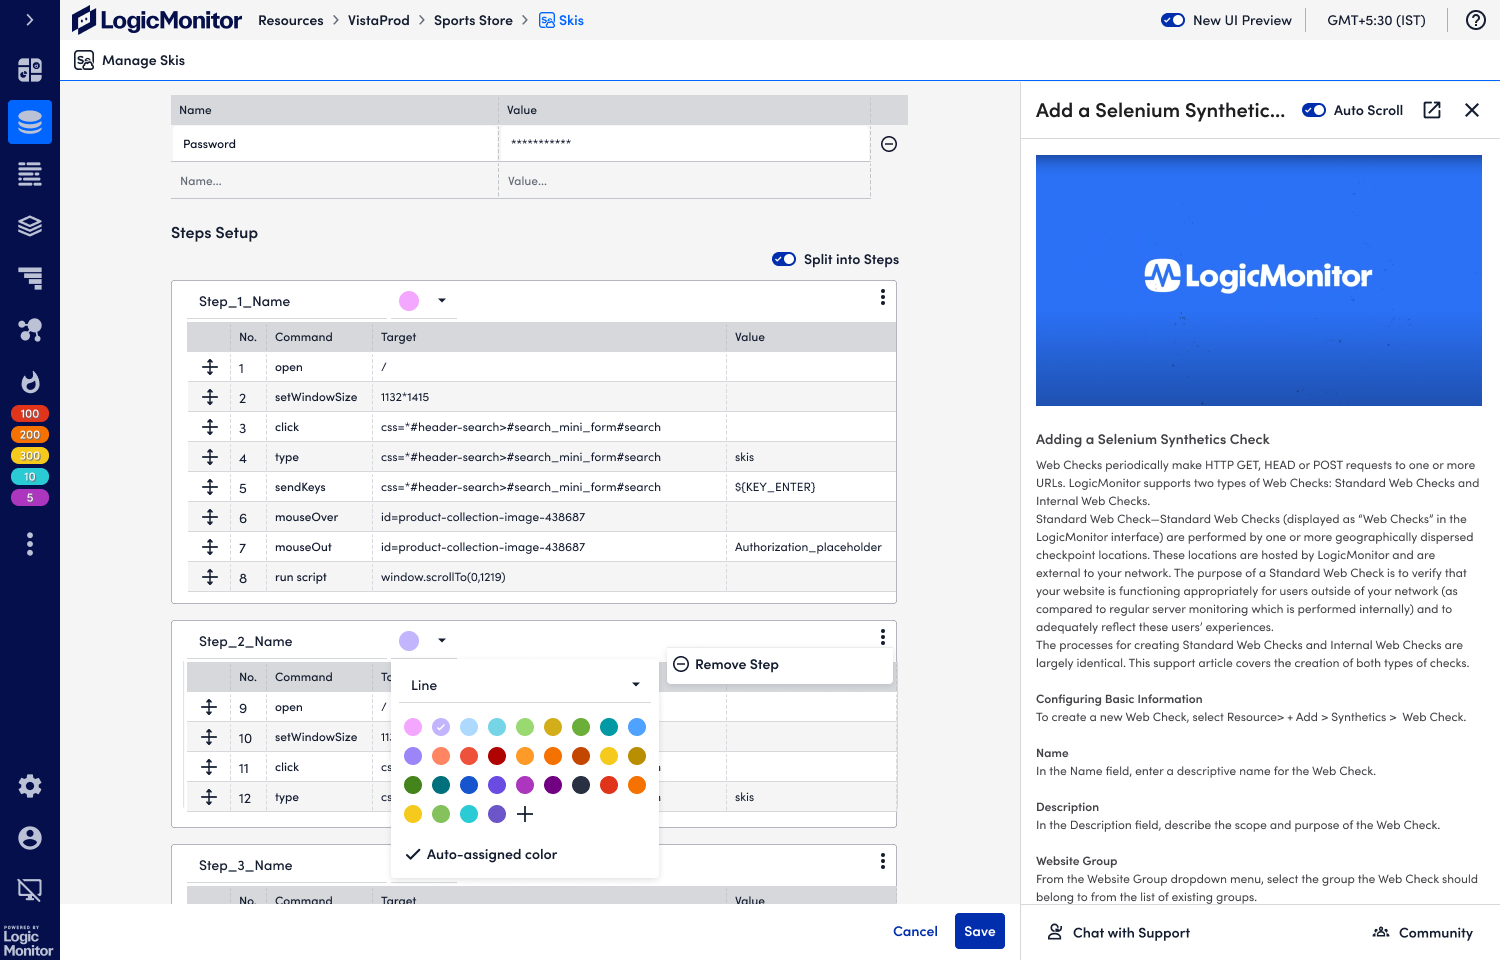
Users will use Selenium plugin to record the monitored actions on the website and generate Selenium scripts. For the section of creating Synthetics checks, what LM does is to enable users to upload their Selenium scripts and set up the monitoring like checkpoints, alert thresholds.
However, Selenium didn't have the concept of "Step" as it simply recorded users' actions. Step allows users to add semantic control to the recorded actions, meaning that users could combine a couple of commands into a step and give it a name. For instance, "Add to cart" could include a couple of commands: click a product listing, adjust the amounts, and then click the button of "add to cart". It allows users to know the latency and error rates of this combination of commands.

<- An example selenium script which includes a list of commands but users have no idea of what that command does.
A more specific design challenge is: How might we allow users to create Steps when they configure Synthetic checks?
Technical constraints: We don't allow users to edit the script for now. In other words, users could only combine commands in a set order to a step.
I brainstormed a bunch of options:
However, even though it works to "group items into another group", it doesn't convey the message to users that "you cannot change the order of steps." Even though I tried to disabled the checkbox to indicate that users cannot skip a command, the interaction is neither intuitive nor effortless.
Instead, following the logic that we need to provide users a way to break a chunk of commands into segments, I tried the interaction of "Splitting into steps":
Now it seems much more simpler. It's not ready to be shipped yet though. When I ran usability testing with users, I found they have difficulty realizing the existence of that function. Plus, it's not consistent with how our design system component indicates affordance. The finalized version makes it easier to understand how it works and keepts it consistent with the design system:
How might we empower users to view their Synthetic checks and pinpoint any errors/ latency threshold breaks?
The second biggest challenge is to enable users to view their Synthetic checks and quickly understand where things are wrong. At the beginning, I thought a table was good enough - it's organized, clean, and easily to list out each checks and results.
Taking a second look, however, the design doesn't fit the purpose: it purely meets a scenario with manual running tests. Is this run automatically or triggered by humans? The answer is latter. As a step forward, I treid waterfall chart:

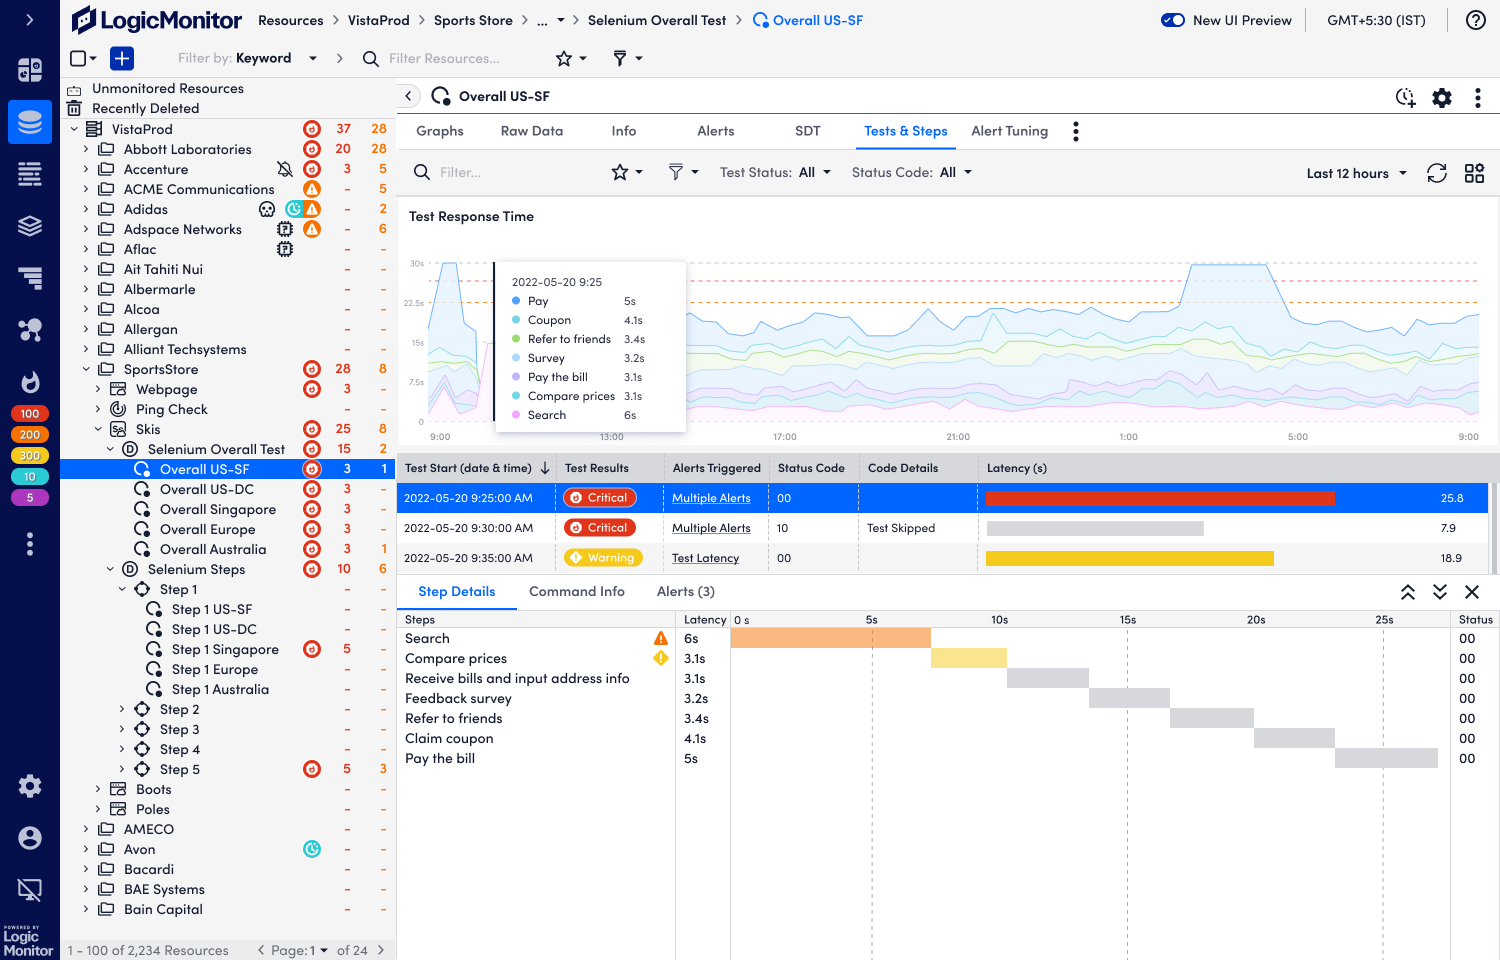
The benefit is clear: it shows more information than separate progress bar of steps. Users can view the total latency of the whole test in addition to the step one, and it's straightforward to identify the longest step. The upstream and downstream context allows users to easily identify where things broke easily. Still, it doesn't fit the use case here. Why?
The synthetic checks are configured to run automatically - at a certain cadence. That means when users check on the synthetic checks for the past 24 hours, it has been run 288 times. Would users want to see the result of one signle run? If so which single run would they want to see? Does the interface show users the information that drove them to open LM to see immediately?
Apparently the visualization doesn't answer these questions. So I took a step back and focused on showing users the aggregate information while helping them quickly identify THE step that would capture their attention, which is usually the anomaly data or the alert triggered one.

Option 1 Sparkline
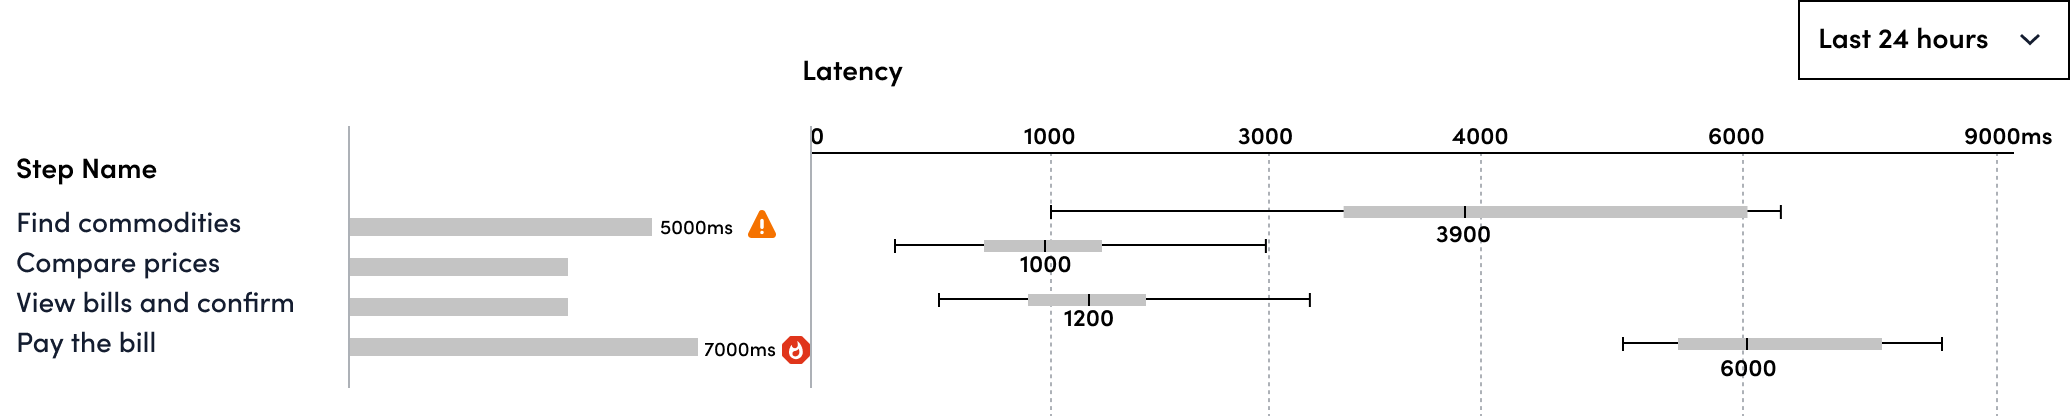
Option 2 Whisker plot

Option 3 Compare latest latency vs. baseline
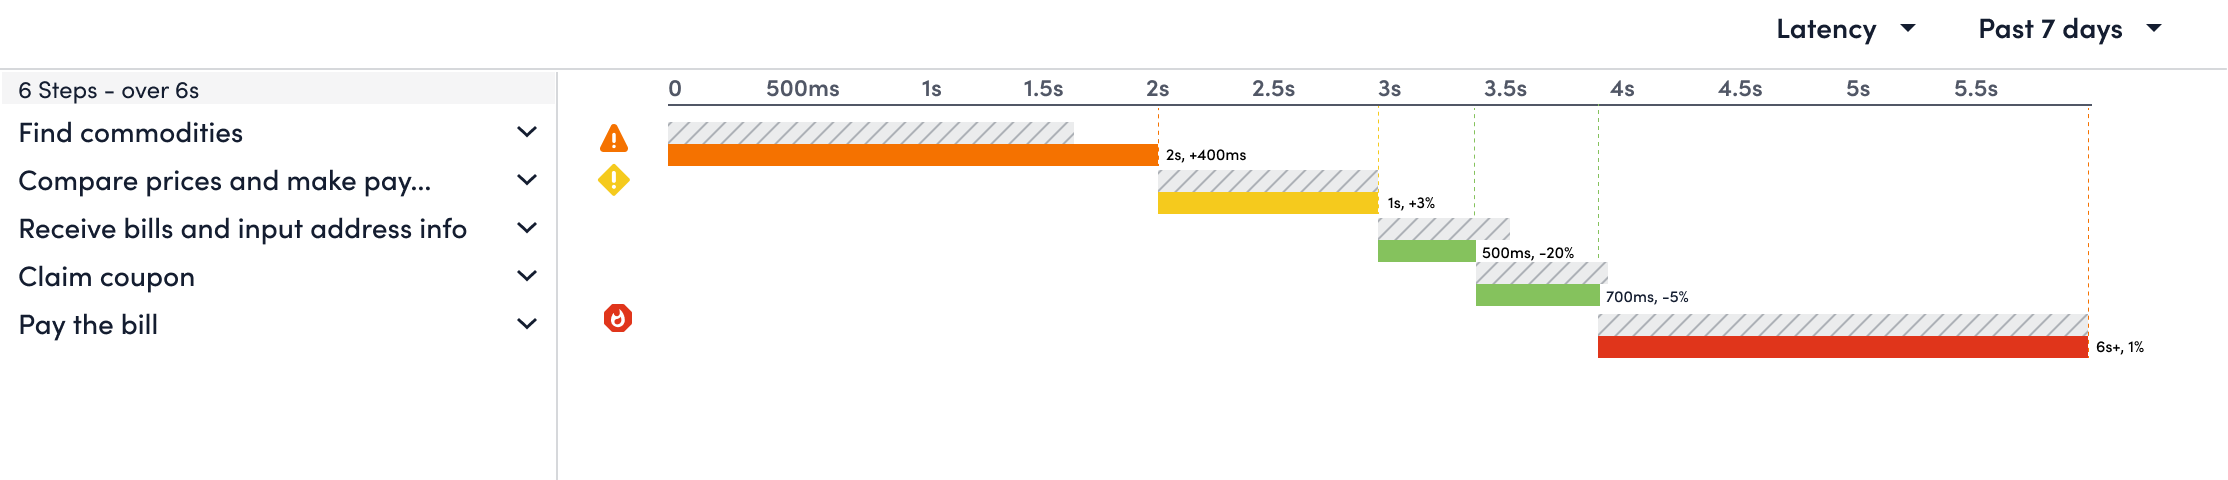
Option 4 Waterfall + baseline
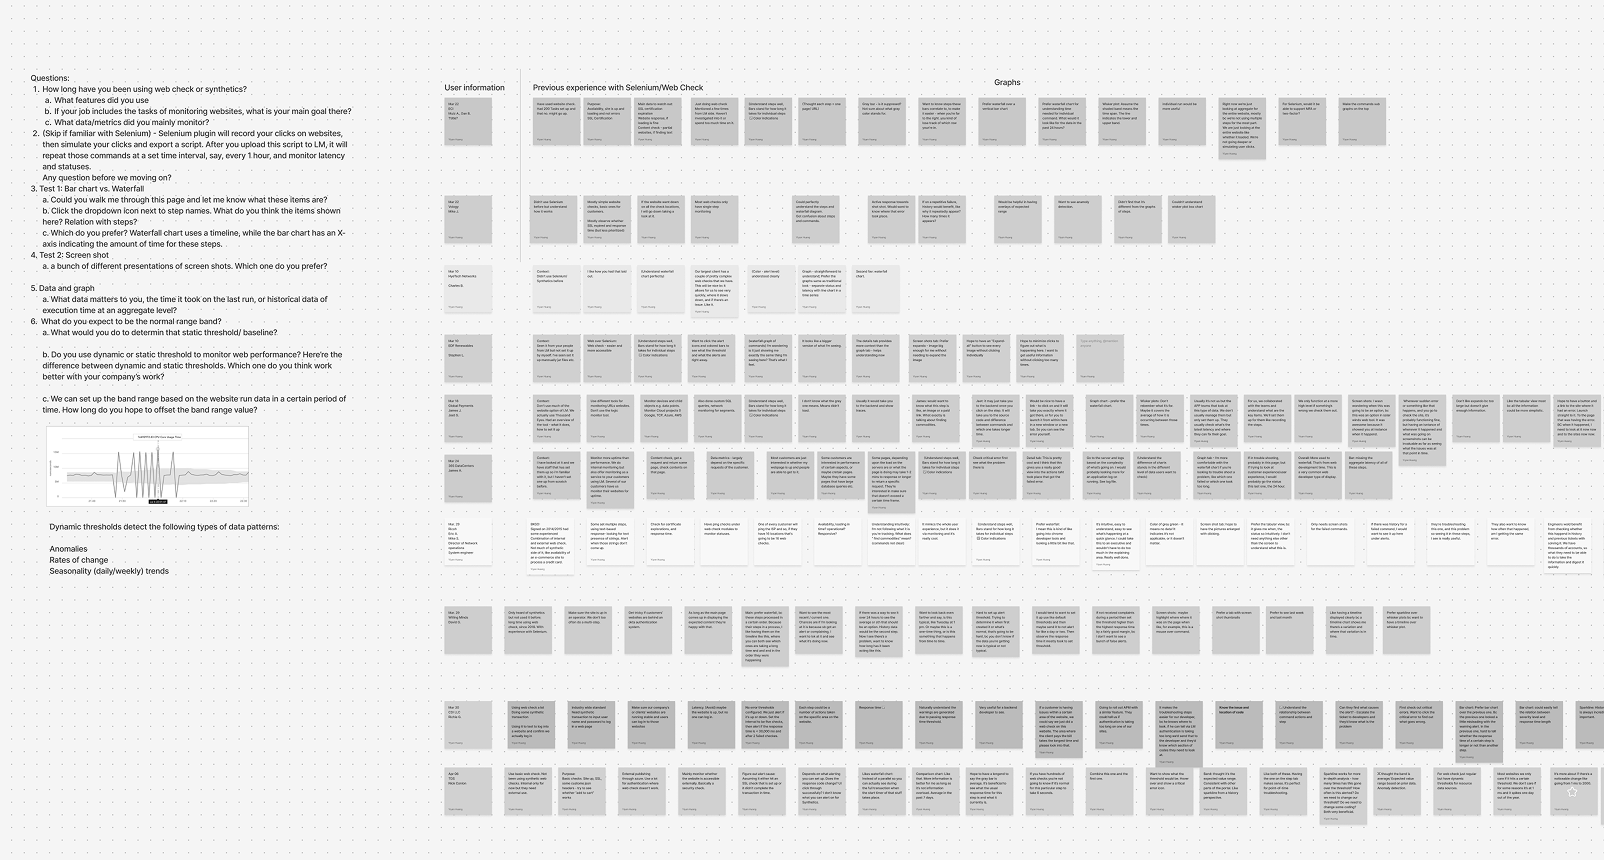
Compared with the last waterfall visualization, these options focused more on giving users insights about the overall trend in the selected time range and helping users decide whether the alert is an actual issue to address while comparing it with the baseline performance (P95 or whisker plot chart metrics). With these options of visualizations, I turned to user for a second round of research finding out their feedback on the diagrams:
7 Users prefer waterfall to visualize transaction process.“Prefer waterfall, because these steps processed in a certain order. Because their steps in a process, I like having them on the timeline like this, where you can both see which ones are taking a long time and and and in the order they were happening.”
4 users expressed that they don’t understand how to read a whisker plot chart or that it requires more explanation on the band for the whisker plot chart.
Meanwhile, 6 users expressed their preference on graph charts because it’s easier to understand like charts in other places and it’s helpful to identify abnormal steps. Users clearly expressed that assistance on anomaly detection would be greatly beneficial for them.
Besides, I also learned more about users' needs:
Users care more about a spike data than a static breaking threshold. They won’t know an appropriate thresholds for latency until they ran it for a while to establish baseline data. “It’s more about if there’s a noticeable change like going from 1 ms to 2000.” For critical applications, they need awareness of any deviations for proactive monitoring.
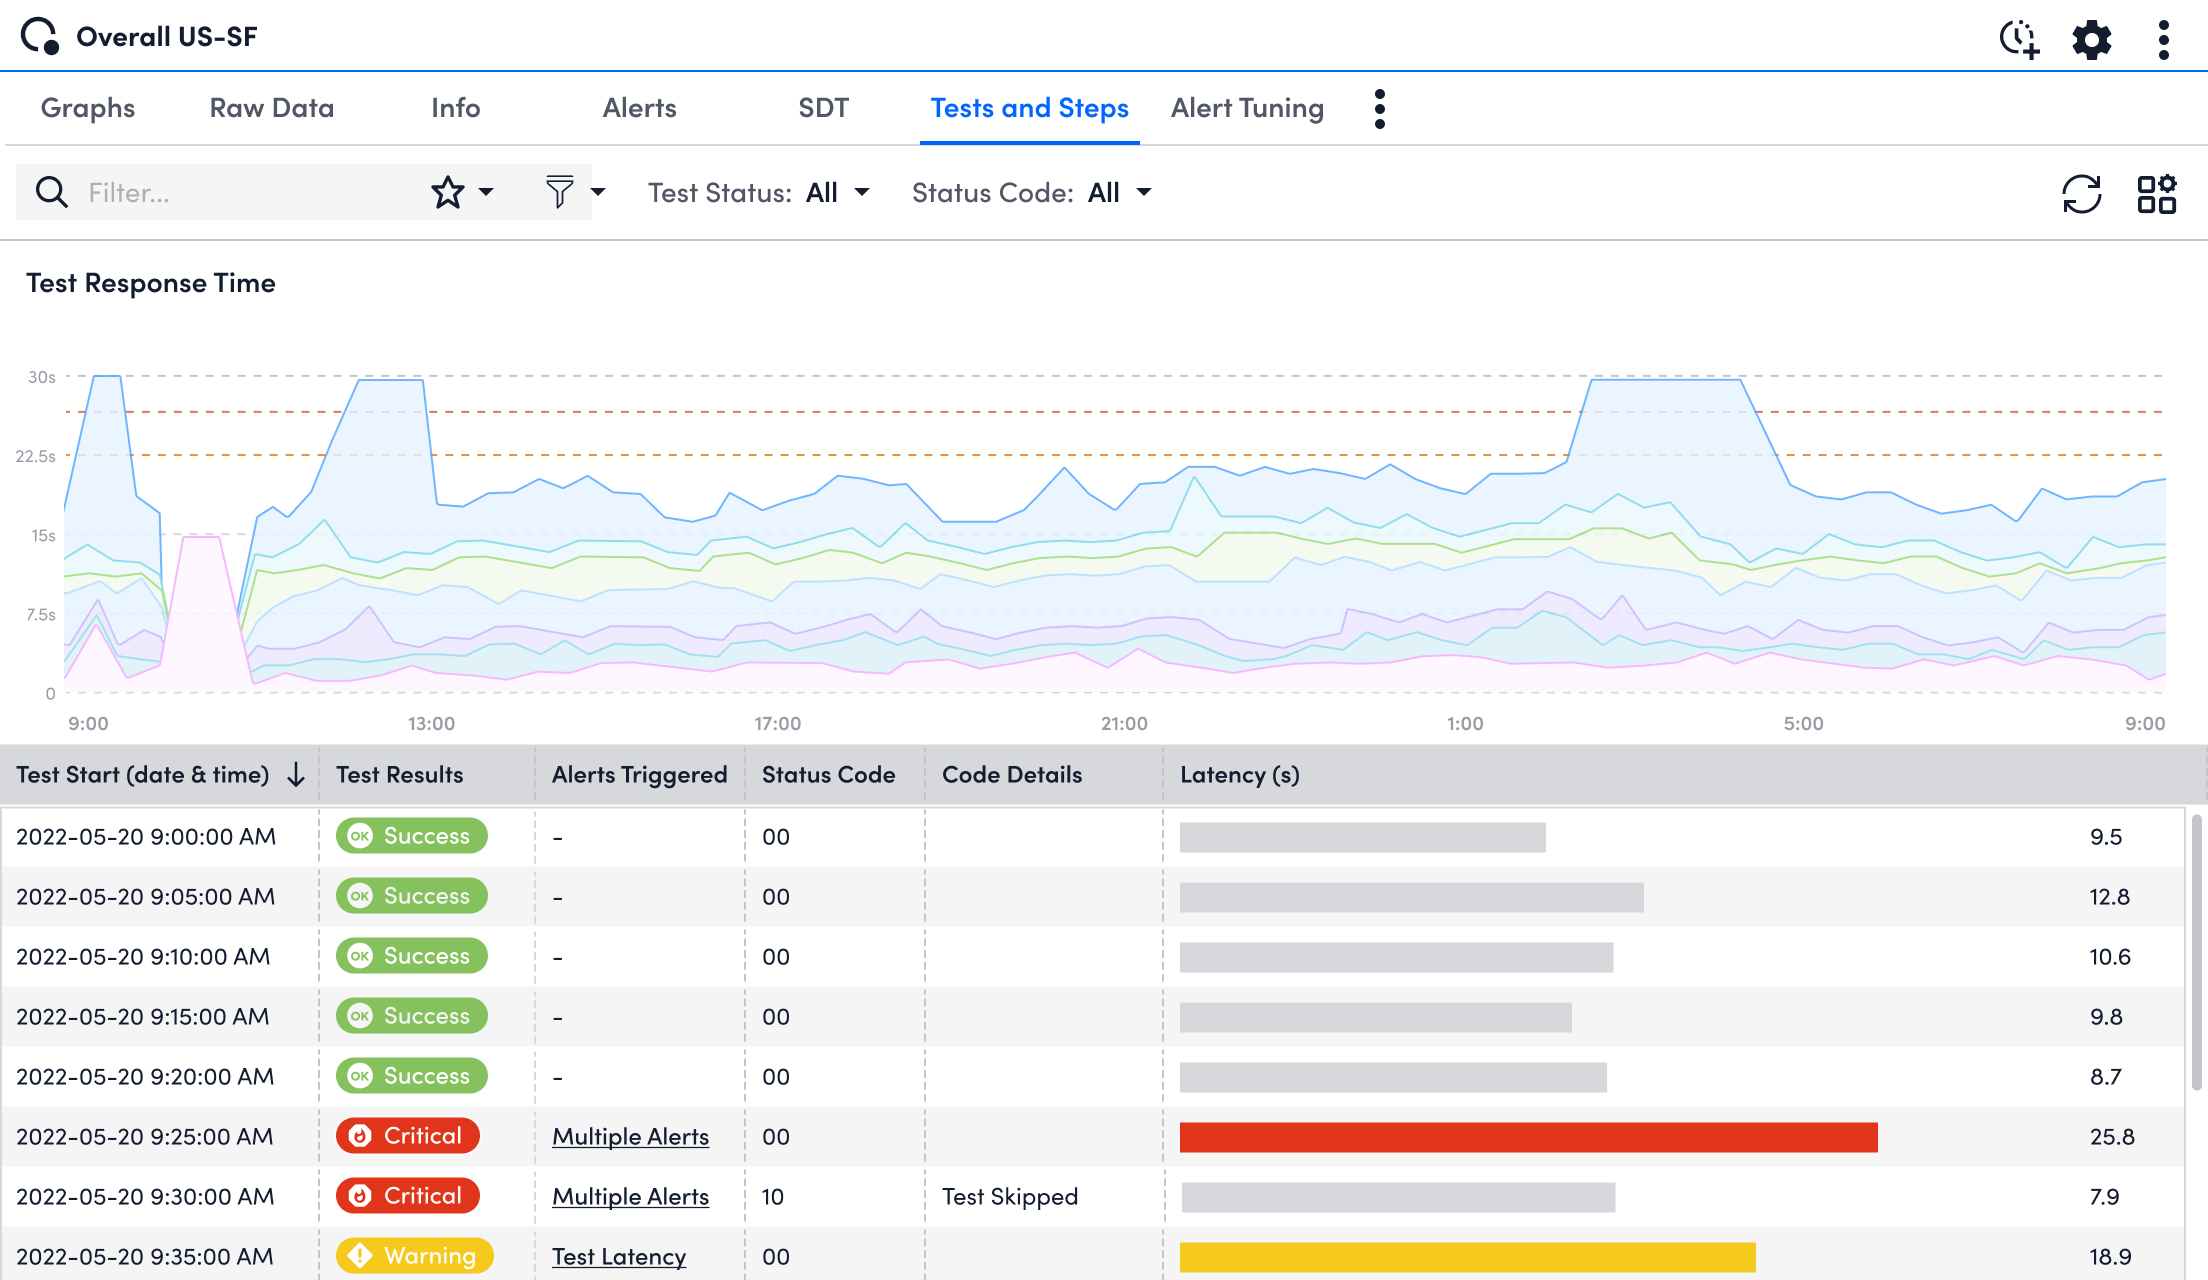
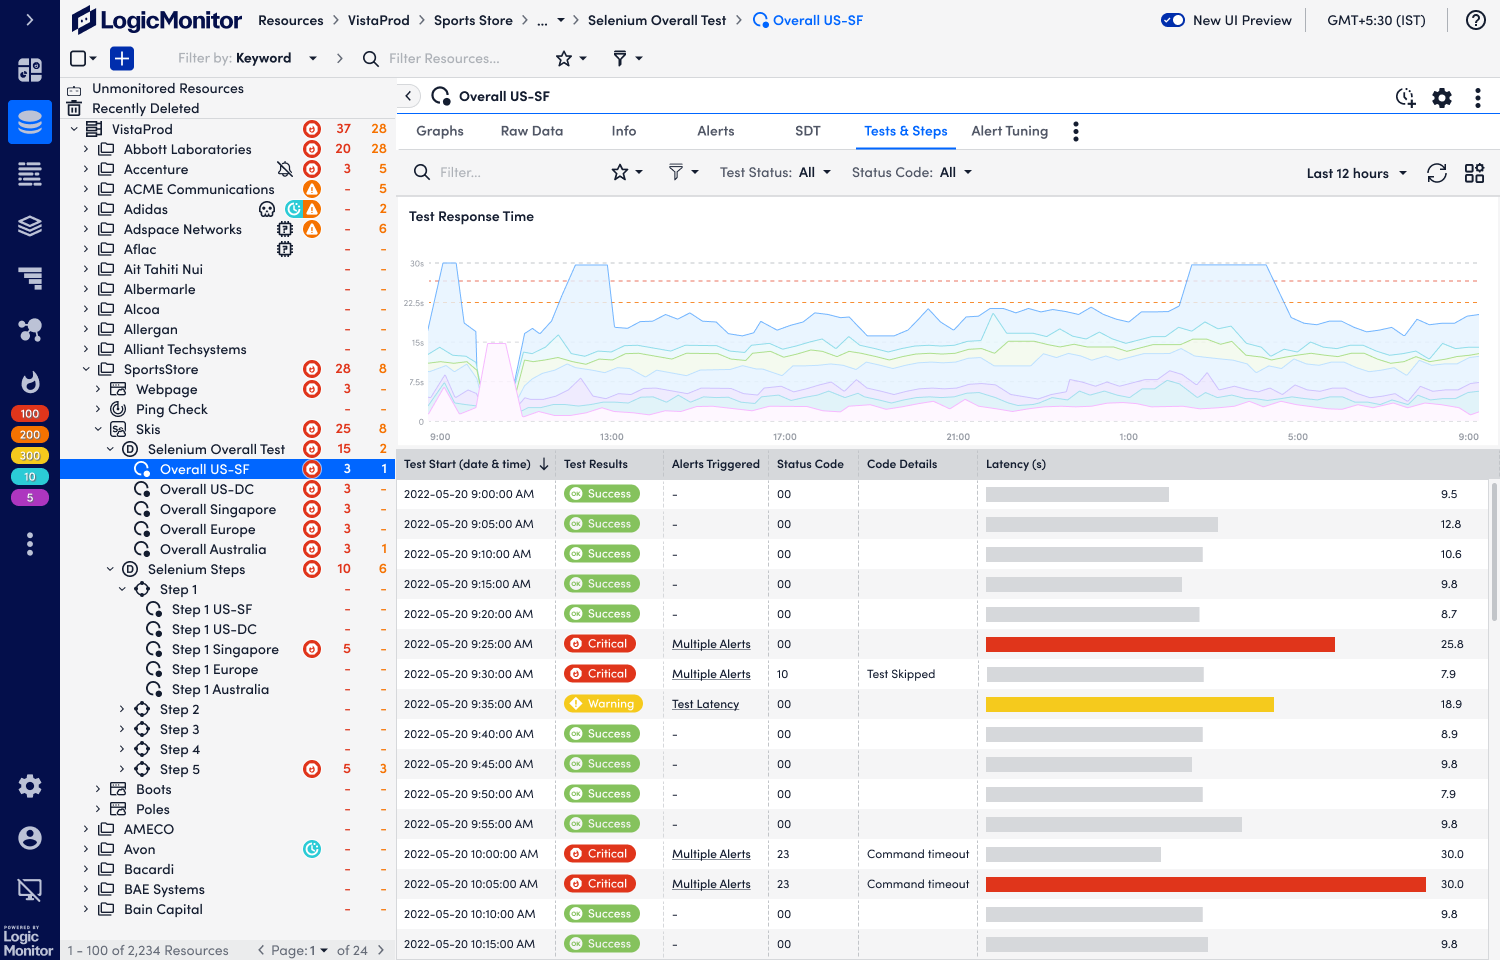
In the end, I decided to pursue another data visualization which shows the historical trend, helps users to easily understand and spot anomaly data, but also allows them to zoom into a timestamp that they found interesting: stacked area chart.